
In September it was announced that 16-year old TikTok superstar, Charli D’Amelio, would be partnering with international coffee and doughnut chain, Dunkin’.
It has been widely reported is that the campaign has been a success, with the drink selling like crazy, and Dunkin’ seeing a 57% increase in downloads of their mobile app. But how much $ are Charli‘s fans spending at Dunkin’ now? That’s what StatSocial can uniquely answer.
StatSocial took a look at the data surrounding Charli’s social audience and Dunkin’s customers. We analyzed the buying behaviors of these two groups, first from over the past 12 months, and then focusing on those purchases made during the campaign’s duration (September 2020). By comparing Charli‘s fans to this control group, StatSocial has shown that there’s been a significant sales lift within Charli‘s social audience.
HOW STATSOCIAL MEASURED THE SALES IMPACT FOR CHARLI’S DUNKIN’ CAMPAIGN
To generate an influencer attribution use case, you need a few different data points to bring together:
- Dunkin’ U.S. Sales Data for the past twelve months
- Dunkin’ U.S. Sales Data for the month of September (the 30 days during which the campaign was live)
- Charli‘s social audience (people who follow and engage with her across her social channels)
- A control audience (the average social media user who is not a Charli fan)
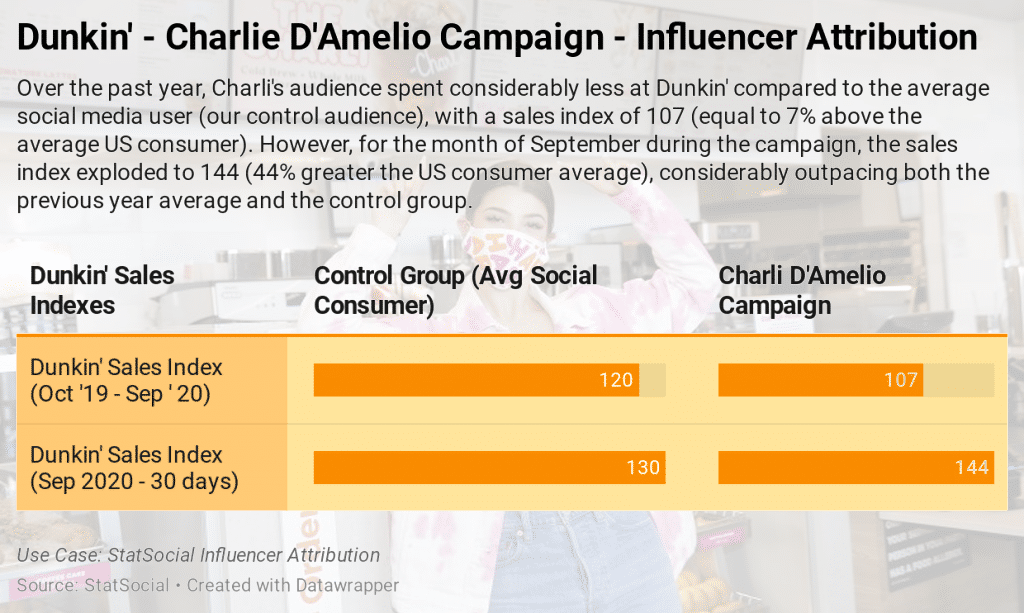
We start by overlaying and indexing the control audience with Dunkin’ sales data for both the past year and the month of September. What we found is that there was a natural lift in the month of September for the average U.S. consumer on social, with a sales index of 120 over the year preceding the campaign’s launch (20% more than the average U.S. consumer) increasing to an index of 130 in September. This increase is possibly due to seasonal effects — people tend to buy more coffee and donuts as the weather cools down.
The next step in our analysis requires us to compare the control group above to Charli‘s fan’s behaviors when it comes to spending their money on Dunkin’. Over the 12 months prior to the launch of the promotion, Charli‘s fans spent considerably less on Dunkin’ than the average social user (our control audience, as noted above), with a sales index of 107 (7% above the average U.S. consumer). However, for the month of September, her fan’s sales index exploded to an index of 144 (44% greater than the U.S. consumer average), considerably outpacing both the average for the previous year, and the control group.
——————————————————————————————