StatSocial Political Influencer Index 2026

The biggest voices in political conversation are coming from outside politics

With less than 80 days until the midterms, StatSocial analyzed the audiences behind more than 500 political voices to see who they actually reach, where those audiences live, and which political communities they represent.

500+ political voices analyzed · 50 U.S. states measured · 39 ranking lists · 0 surveys, panels, or modeled responses

8.3MLargest working journalist audience
Logan Paul’s is 8x bigger
55%Reach exactly one top ten
Of the 225 people who reach a top 10 in this Index
22%Of Piers Morgan’s following is American
The median voice here is 81%. A follower count cannot tell you the difference.
The Index at a glance

500 voices, almost nothing in common

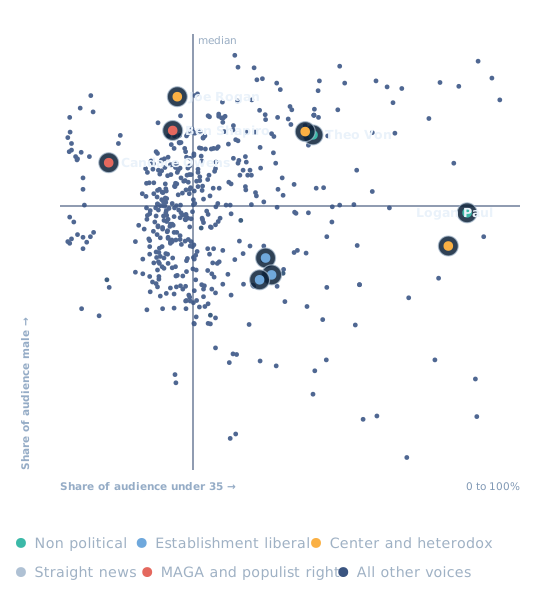
Every audience in the Index, plotted by share of audience under 35 against share male, with roster medians marked. Ringed points are the ten largest.

Scatter plot of 500 measured audiences. Horizontal axis is the share of each audience under 35, vertical axis is the share male. Lines mark the roster medians of 29 and 63 percent. The ten largest audiences are ringed and coloured by political label, and they are spread across the entire plot.

They share almost nothing: Candace Owens’ audience is 11% under 35, Logan Paul’s is 88%.

The rankings

Six categories of rankings

Audience reach, political composition, geography, demographics, profession and industry, and policy issues: 39 rankings between them, plus a card for every state. Two hundred and twenty five people reach a top ten somewhere in the Index. More than half of them appear on exactly one list.

The 10 biggest voices in political conversation

The ten biggest audiences American political conversation now flows through, whoever holds the microphone. This is the only measure on the page that starts from public follower counts: platform totals times the measured American share, not deduplicated across platforms. It is the least reliable number here. We show it because it is the number the industry uses. Everything else on this page is measured against real people.
7K66.4M
  1. 01Logan Paul66.4M
  2. 02Joe Rogan45.2M
  3. 03Stephen Colbert29.8M
  4. 04Jimmy Kimmel28.7M
  5. 05Candace Owens27.3M
  6. 06Ben Shapiro24.4M
  7. 07Theo Von23.1M
  8. 08Trevor Noah18.3M
  9. 09Jordan Peterson16.4M
  10. 10Shawn Ryan14.5M

The 10 biggest opinion makers in political conversation

The ten biggest audiences held by political commentators and opinion hosts, on any platform. Same estimate: public counts times measured US share, not deduplicated across platforms.
7K66.4M
  1. 01Candace Owens27.3M
  2. 02Ben Shapiro24.4M
  3. 03Jordan Peterson16.4M
  4. 04Tucker Carlson14.0M
  5. 05Sean Hannity12.8M
  6. 06Benny Johnson12.6M
  7. 07Stephen A. Smith11.5M
  8. 08Bill Maher10.8M
  9. 09Rachel Maddow9.1M
  10. 10Tomi Lahren8.7M

The 10 biggest journalists in political conversation

The ten biggest audiences held by working news journalists: anchors, correspondents, and reporters. Same estimate: public counts times measured US share, not deduplicated across platforms.
7K66.4M
  1. 01Anderson Cooper8.3M
  2. 02Kaitlan Collins4.0M
  3. 03Jake Tapper3.1M
  4. 04Bret Baier2.5M
  5. 05Jim Acosta2.4M
  6. 06Christiane Amanpour1.8M
  7. 07Jorge Ramos1.8M
  8. 08George Stephanopoulos1.7M
  9. 09Ronan Farrow1.5M
  10. 10Maggie Haberman1.3M
Reach is not influence. Concentration rewards focus, so large audiences are diluted by construction: the smallest fifth of audiences take roughly 3.5 times as many top-ten places on index measures as the largest fifth.

Congress is excluded from the reach rankings. Bernie Sanders and Alexandria Ocasio-Cortez both rank top ten on reach and are held out, so this measure covers media voices. Sitting members still appear in the state and issue rankings, where the question is who an audience is rather than how large it is.

The 10 biggest echo chambers in political media

Concentration within a single faction; 1.0 is an unsorted audience.
1.1x5.5x
  1. 01Rogan O'Handley3.14x
  2. 02Brandon Tatum3.11x
  3. 03Dinesh D'Souza2.95x
  4. 04Anthony Brian Logan (ABL)2.91x
  5. 05Greg Kelly2.91x
  6. 06Steve Bannon2.90x
  7. 07Liz Wheeler2.89x
  8. 08Larry Elder2.82x
  9. 09Robby Starbuck2.80x
  10. 10Mark Levin2.80x

The 10 most bipartisan audiences in the Index

Bipartisan reach: 100 is perfectly balanced.
299
  1. 01Reihan Salam99.4
  2. 02Jamie Kirchick99.2
  3. 03David French98.8
  4. 04Tom Holland (historian)98.8
  5. 05Jason Calacanis98.2
  6. 06Major Garrett97.4
  7. 07S.E. Cupp97.4
  8. 08Caitlin Flanagan96.4
  9. 09Matt Taibbi96.4
  10. 10Megan McArdle95.6

The 10 most left leaning audiences in the Index

Partisan lean from observed follows: 0 all right, 100 all left, 50 even.
1880
  1. 01Shaun (@Shaun_vids)80.2
  2. 02Nima Shirazi76.8
  3. 03David Griscom76.7
  4. 04Philosophy Tube76.7
  5. 05Hasan Piker76.6
  6. 06Michael Moore76.2
  7. 07Amanda Seales76.2
  8. 08Kimberly Nicole Foster75.8
  9. 09Ash Sarkar75.8
  10. 10Rhiannon Hamam75.4

The 10 most right leaning audiences in the Index

Partisan lean from observed follows: 0 all right, 100 all left, 50 even.
1880
  1. 01Steve Bannon17.5
  2. 02Dan Bongino17.7
  3. 03Mark Levin17.9
  4. 04Jesse Watters17.9
  5. 05Sean Hannity18.1
  6. 06Dinesh D'Souza18.4
  7. 07Kayleigh McEnany18.9
  8. 08Greg Gutfeld18.9
  9. 09Tomi Lahren19.4
  10. 10Candace Owens19.6

The 10 voices whose audiences lean opposite their politics

These voices sit on one side of politics; their audiences' follows point the other way. The value is the share of each audience's sided following that points right.
  1. 01Ana Navarro20% right
  2. 02Steve Schmidt21% right
  3. 03Rick Wilson23% right
  4. 04David Frum25% right
  5. 05Michael Steele25% right
  6. 06Tim Miller25% right
  7. 07Anne Applebaum26% right
  8. 08Tom Nichols26% right
  9. 09Mona Charen26% right
  10. 10Jennifer Rubin27% right

The 10 right-leaning audiences most dominated by MAGA

Of each right-leaning audience's right-of-center following, the share pointing MAGA rather than traditional conservative. Audiences under 100,000 excluded.
  1. 01Mike Majlak92%
  2. 02Adin Ross92%
  3. 03Andrew Tate90%
  4. 04Taylor Lewan90%
  5. 05Kyle Forgeard90%
  6. 06Brett Cooper90%
  7. 07Will Compton90%
  8. 08Alex Jones88%
  9. 09Joe Rogan87%
  10. 10Rogan O'Handley87%

The 10 Washington, D.C. voices with the strongest audience presence

Share of audience located in Washington, D.C.
1%26%
  1. 01Danielle Pletka25.9%
  2. 02John Ashbrook23.8%
  3. 03Kori Schake23.2%
  4. 04Lisa Lerer21.8%
  5. 05Burgess Everett19.5%
  6. 06Mark Dubowitz19.5%
  7. 07Mark Leibovich19.4%
  8. 08Carlos Lozada18.9%
  9. 09Alex Thompson18.2%
  10. 10Dan Balz18.2%

The 10 political voices that matter most in the midterm battlegrounds

Share of audience located across the seven 2024 battleground states
9%27%
  1. 01Erick Erickson26.6%
  2. 02Roland Martin22.5%
  3. 03Michael Smerconish21.4%
  4. 04John Nichols21.4%
  5. 05Marc Lamont Hill20.8%
  6. 06Charlamagne tha God19.9%
  7. 07Rachel Campos-Duffy19.9%
  8. 08Whoopi Goldberg19.8%
  9. 09Jemele Hill19.4%
  10. 10Charlie Sykes19.3%

The 10 voices reaching the most local news consumers

Share of audience that consumes local news
6%76%
  1. 01Lisa Lerer76.2%
  2. 02Lester Holt75.9%
  3. 03Martha Raddatz75.6%
  4. 04Dan Balz74.6%
  5. 05Chris Jansing73.9%
  6. 06Rachael Bade73.6%
  7. 07Jonathan Karl73.5%
  8. 08Shane Goldmacher73.2%
  9. 09Burgess Everett72.7%
  10. 10Marc Caputo72.1%

State by state

Which voices are most concentrated in each state

The five voices whose audiences sit most heavily in each state, measured against the Index average. Concentration is not reach. A voice with a small, tightly clustered audience will outrank a voice with a large, evenly spread one, and in twelve states that is what happens: the top of the card is held by co-hosts of a single show whose audience happens to cluster there. Cards run from the most concentrated state to the least. The lean noted on each card describes the audiences of those five voices, not the politics of the voices themselves and not the politics of the state.

Jump to a state: Alabama Alaska Arizona* Arkansas California Colorado Connecticut Delaware Florida Georgia* Hawaii Idaho Illinois Indiana Iowa Kansas Kentucky Louisiana Maine Maryland Massachusetts Michigan* Minnesota Mississippi Missouri Montana Nebraska Nevada* New Hampshire New Jersey New Mexico New York North Carolina* North Dakota Ohio Oklahoma Oregon Pennsylvania* Rhode Island South Carolina South Dakota Tennessee Texas Utah Vermont Virginia Washington West Virginia Wisconsin* Wyoming * 2024 battleground state

Alabama

These five audiences lean right · leader 4.3x the Index average
  1. 01Clay Travis430
  2. 02Russell Moore326
  3. 03Roy Wood Jr.261
  4. 04Steve Doocy241
  5. 05Ainsley Earhardt231

Alaska

These five audiences lean left · leader 2.4x the Index average
  1. 01Trevor Noah242
  2. 02V Spehar219
  3. 03Shaun217
  4. 04Philosophy Tube215
  5. 05Francis Foster206

Arizona

These five audiences lean right · leader 2.3x the Index average
  1. 01David Pakman229
  2. 02Jason Selvig193
  3. 03Hugh Hewitt188
  4. 04Brandon Tatum183
  5. 05Dennis Prager183

Arkansas

These five audiences lean right · leader 3.1x the Index average
  1. 01Russell Moore313
  2. 02Clay Travis281
  3. 03Sarah Stewart Holland230
  4. 04Beth Silvers208
  5. 05Brett Cooper202

California

These five audiences are mixed · leader 2.2x the Index average
  1. 01David Friedberg222
  2. 02Dwarkesh Patel220
  3. 03Jason Calacanis204
  4. 04David Sacks188
  5. 05Sam Harris181

Colorado

These five audiences are mixed · leader 2.2x the Index average
  1. 01David Sirota219
  2. 02Hugh Hewitt170
  3. 03Dennis Prager151
  4. 04Shannon Sharpe149
  5. 05Thom Hartmann147

Connecticut

These five audiences lean left · leader 4.9x the Index average
  1. 01Emily Maitlis491
  2. 02Alastair Campbell488
  3. 03Lewis Goodall443
  4. 04Rory Stewart426
  5. 05Jon Sopel384

Delaware

These five audiences lean left · leader 2.8x the Index average
  1. 01Emily Maitlis278
  2. 02Rory Stewart262
  3. 03Jon Sopel260
  4. 04Lewis Goodall248
  5. 05Michael Smerconish228

Florida

These five audiences are mixed · leader 5.3x the Index average
  1. 01Marc Caputo534
  2. 02Andrew Gillum313
  3. 03Jorge Ramos224
  4. 04Brian Kilmeade180
  5. 05Danny Jones177

Georgia

These five audiences lean left · leader 5.3x the Index average
  1. 01Erick Erickson535
  2. 02Roland Martin332
  3. 03Whoopi Goldberg263
  4. 04Charlamagne tha God235
  5. 05Amanda Seales234

Hawaii

These five audiences lean left · leader 2.4x the Index average
  1. 01V Spehar244
  2. 02Adam Mockler228
  3. 03David Pakman225
  4. 04Kim Iversen199
  5. 05Ronny Chieng189

Idaho

These five audiences are mixed · leader 3.3x the Index average
  1. 01Brett Cooper326
  2. 02Glenn Beck243
  3. 03V Spehar219
  4. 04Eric Weinstein218
  5. 05Shawn Ryan212

Illinois

These five audiences lean left · leader 1.6x the Index average
  1. 01David Axelrod159
  2. 02Alex Cooper144
  3. 03Dave Zirin144
  4. 04Adam Johnson143
  5. 05Parker Molloy143

Indiana

These five audiences lean right · leader 3.9x the Index average
  1. 01Alex Clark385
  2. 02Jason Whitlock190
  3. 03Dan Abrams177
  4. 04V Spehar154
  5. 05Glenn Beck151

Iowa

These five audiences are mixed · leader 6.9x the Index average
  1. 01Steve Deace694
  2. 02Will Compton289
  3. 03Taylor Lewan230
  4. 04Jesse Sebastiani219
  5. 05Michael Duncan215

Kansas

These five audiences are mixed · leader 3.6x the Index average
  1. 01Jason Kander363
  2. 02Jason Whitlock304
  3. 03Will Compton197
  4. 04Jason Selvig166
  5. 05Will Cain164

Kentucky

These five audiences lean right · leader 7.1x the Index average
  1. 01Sarah Stewart Holland713
  2. 02Alex Clark621
  3. 03Beth Silvers458
  4. 04Russell Moore413
  5. 05John Ashbrook346

Louisiana

These five audiences lean left · leader 3.2x the Index average
  1. 01James Carville317
  2. 02Roland Martin232
  3. 03Charlamagne tha God228
  4. 04Shannon Sharpe213
  5. 05Donna Brazile203

Maine

These five audiences are mixed · leader 2.1x the Index average
  1. 01Mike Majlak213
  2. 02Heather Cox Richardson212
  3. 03Alastair Campbell201
  4. 04Rory Stewart192
  5. 05Emily Maitlis190

Maryland

These five audiences are mixed · leader 2.6x the Index average
  1. 01Stavros Halkias260
  2. 02Katie Hopkins238
  3. 03Roland Martin210
  4. 04Alastair Campbell209
  5. 05Piers Morgan208

Massachusetts

These five audiences lean left · leader 2.7x the Index average
  1. 01Rory Stewart268
  2. 02Alastair Campbell244
  3. 03Emily Maitlis230
  4. 04Lewis Goodall228
  5. 05Jon Sopel215

Michigan

These five audiences lean left · leader 3.1x the Index average
  1. 01Taylor Lewan306
  2. 02Tim Alberta195
  3. 03Michael Kosta181
  4. 04Jemele Hill171
  5. 05Leah Litman166

Minnesota

These five audiences lean left · leader 4.8x the Index average
  1. 01Al Franken484
  2. 02Sara Sidner185
  3. 03Aaron Rupar175
  4. 04Michael Hobbes171
  5. 05Rebecca Nagle167

Mississippi

These five audiences lean right · leader 4.2x the Index average
  1. 01Russell Moore424
  2. 02Clay Travis403
  3. 03Steve Doocy283
  4. 04Ainsley Earhardt265
  5. 05Allen West253

Missouri

These five audiences lean left · leader 7.2x the Index average
  1. 01Jason Kander715
  2. 02Jason Whitlock228
  3. 03Trymaine Lee190
  4. 04Sarah Kendzior181
  5. 05Sarah Stewart Holland180

Montana

These five audiences are mixed · leader 7.7x the Index average
  1. 01Katie Miller773
  2. 02Jason Selvig403
  3. 03Charlie Warzel246
  4. 04Michael Hobbes223
  5. 05Rebecca Nagle220

Nebraska

These five audiences are mixed · leader 14.6x the Index average
  1. 01Will Compton1464
  2. 02Taylor Lewan636
  3. 03Alastair Campbell245
  4. 04Rory Stewart239
  5. 05Symone Sanders220

Nevada

These five audiences lean right · leader 2.3x the Index average
  1. 01Myron Gaines231
  2. 02Brett Cooper195
  3. 03Danny Jones180
  4. 04Andrew Tate172
  5. 05Maria Konnikova165

New Hampshire

These five audiences lean left · leader 3.8x the Index average
  1. 01Alastair Campbell378
  2. 02Emily Maitlis362
  3. 03Rory Stewart357
  4. 04Lewis Goodall335
  5. 05Jon Sopel299

New Jersey

These five audiences are mixed · leader 1.8x the Index average
  1. 01Greg Kelly181
  2. 02Michael Smerconish169
  3. 03Charlamagne tha God168
  4. 04Sara Haines159
  5. 05Myron Gaines150

New Mexico

These five audiences lean left · leader 2.2x the Index average
  1. 01Thom Hartmann225
  2. 02Rebecca Nagle224
  3. 03Maria Hinojosa215
  4. 04David Pakman197
  5. 05Amy Goodman185

New York

These five audiences lean left · leader 2.3x the Index average
  1. 01Max Tani227
  2. 02Lydia Polgreen224
  3. 03Gerard Baker220
  4. 04Evan Osnos195
  5. 05M. Gessen193

North Carolina

These five audiences are mixed · leader 2.0x the Index average
  1. 01Russell Moore205
  2. 02Roland Martin174
  3. 03Mike Majlak161
  4. 04Bakari Sellers159
  5. 05Steve Doocy157

North Dakota

These five audiences lean left · leader 3.1x the Index average
  1. 01Rory Stewart306
  2. 02Emily Maitlis288
  3. 03Alastair Campbell273
  4. 04Jon Sopel247
  5. 05Lewis Goodall245

Ohio

These five audiences are mixed · leader 1.8x the Index average
  1. 01Jesse Sebastiani175
  2. 02Taylor Lewan163
  3. 03Jason Whitlock158
  4. 04Alex Cooper155
  5. 05John Ashbrook155

Oklahoma

These five audiences lean left · leader 3.2x the Index average
  1. 01Rebecca Nagle317
  2. 02Beth Silvers251
  3. 03Sarah Stewart Holland248
  4. 04Russell Moore234
  5. 05Dan Abrams215

Oregon

These five audiences lean left · leader 5.3x the Index average
  1. 01Robert Evans527
  2. 02Thom Hartmann205
  3. 03Michael Hobbes202
  4. 04Annie Kelly198
  5. 05Beau of the Fifth Column190

Pennsylvania

These five audiences are mixed · leader 2.7x the Index average
  1. 01Michael Smerconish267
  2. 02Marc Lamont Hill171
  3. 03Stavros Halkias140
  4. 04Alastair Campbell138
  5. 05Danny Jones138

Rhode Island

These five audiences are mixed · leader 3.5x the Index average
  1. 01Jason Selvig351
  2. 02Mike Majlak263
  3. 03David Pakman210
  4. 04Lester Holt198
  5. 05Michael Hobbes176

South Carolina

These five audiences are mixed · leader 4.9x the Index average
  1. 01Bakari Sellers486
  2. 02Trey Gowdy449
  3. 03Dan Abrams311
  4. 04Ainsley Earhardt289
  5. 05Peter Hamby234

South Dakota

These five audiences are mixed · leader 3.9x the Index average
  1. 01Will Compton390
  2. 02Taylor Lewan287
  3. 03Tomi Lahren266
  4. 04Will Cain254
  5. 05Jesse Sebastiani243

Tennessee

These five audiences lean right · leader 7.9x the Index average
  1. 01Taylor Lewan788
  2. 02Clay Travis622
  3. 03Russell Moore359
  4. 04Will Compton335
  5. 05Eric Metaxas241

Texas

These five audiences lean right · leader 2.0x the Index average
  1. 01Ted Cruz202
  2. 02Jorge Ramos186
  3. 03Will Cain175
  4. 04Eric Metaxas174
  5. 05Akaash Singh172

Utah

These five audiences lean right · leader 5.5x the Index average
  1. 01McKay Coppins546
  2. 02Eric Weinstein419
  3. 03Glenn Beck281
  4. 04Will Witt203
  5. 05Michael Knowles201

Vermont

These five audiences lean left · leader 3.7x the Index average
  1. 01Eric Weinstein373
  2. 02Bernie Sanders263
  3. 03Amy Goodman247
  4. 04David Sirota247
  5. 05Audie Cornish226

Virginia

These five audiences lean left · leader 3.2x the Index average
  1. 01Alastair Campbell317
  2. 02Rory Stewart316
  3. 03Emily Maitlis293
  4. 04Lewis Goodall284
  5. 05Jon Sopel254

Washington

These five audiences lean left · leader 2.2x the Index average
  1. 01Rory Stewart225
  2. 02Jon Sopel198
  3. 03Katie Herzog190
  4. 04Rebecca Nagle183
  5. 05Helen Lewis173

West Virginia

These five audiences lean right · leader 3.8x the Index average
  1. 01Jason Selvig380
  2. 02Steve Doocy244
  3. 03Brian Kilmeade211
  4. 04V Spehar210
  5. 05Ainsley Earhardt203

Wisconsin

These five audiences lean right · leader 7.4x the Index average
  1. 01John Nichols743
  2. 02Charlie Sykes425
  3. 03Rachel Campos-Duffy255
  4. 04Emily Jashinsky167
  5. 05Alex Cooper161

Wyoming

These five audiences lean right · leader 2.3x the Index average
  1. 01Danny Jones229
  2. 02Jason Selvig200
  3. 03David Webb194
  4. 04Steve Deace179
  5. 05Glenn Beck175

Voices with the most male audiences

Share of audience identified as male
17%91%
  1. 01Eric Weinstein91.1%
  2. 02Jesse Sebastiani90.0%
  3. 03Taylor Lewan89.1%
  4. 04David Friedberg88.9%
  5. 05Dwarkesh Patel88.8%
  6. 06Adin Ross86.9%
  7. 07Marshall Kosloff86.8%
  8. 08Sam Harris86.6%
  9. 09Andrew Tate86.4%
  10. 10Tim Dillon86.4%

Voices with the most female audiences

Share of audience identified as female
9%83%
  1. 01Aunt Karen83.1%
  2. 02V Spehar82.7%
  3. 03Beth Silvers79.2%
  4. 04Sarah Stewart Holland78.4%
  5. 05Olivia Julianna75.7%
  6. 06Dean Withers75.2%
  7. 07Aaron Parnas75.1%
  8. 08Touré71.1%
  9. 09Joy Behar69.0%
  10. 10Amanda Seales66.8%

Political voices with audiences under 35

Share of audience aged under 35
2%96%
  1. 01Mike Majlak95.6%
  2. 02Adin Ross93.9%
  3. 03Vaush (@Vaush)92.1%
  4. 04Jesse Sebastiani90.9%
  5. 05Dean Withers90.6%
  6. 06Logan Paul88.5%
  7. 07Stavros Halkias86.7%
  8. 08Akaash Singh85.6%
  9. 09Jordan Peterson84.4%
  10. 10Kyle Forgeard82.6%

Political voices with audiences 45 and older

Share of audience aged 45 or older
1%92%
  1. 01Mollie Hemingway92.3%
  2. 02Jennifer Rubin90.2%
  3. 03Mark Levin89.9%
  4. 04Buck Sexton89.4%
  5. 05Rich Lowry88.7%
  6. 06John Heilemann86.9%
  7. 07James Carville86.3%
  8. 08John Podhoretz85.9%
  9. 09Mike Murphy85.5%
  10. 10Dan Bongino84.7%

The 10 political voices with audiences earning $100K or more

Share of audience in households earning $100,000 or more
27%65%
  1. 01David Friedberg65.0%
  2. 02David Sacks64.2%
  3. 03Anthony Pompliano62.7%
  4. 04Scott Galloway62.6%
  5. 05William McGurn62.1%
  6. 06Jason Calacanis61.7%
  7. 07Kara Swisher60.8%
  8. 08Chamath Palihapitiya60.8%
  9. 09Dwarkesh Patel60.8%
  10. 10Tyler Cowen59.6%

Voices with the largest Black audience share

Share of each audience identified as Black. Dashed line marks the U.S. baseline of 12.8%.
0%61%
  1. 01Roland Martin60.4%
  2. 02Charlamagne tha God53.9%
  3. 03Amanda Seales49.1%
  4. 04Angela Rye47.5%
  5. 05Kimberly Nicole Foster46.5%
  6. 06Marc Lamont Hill46.4%
  7. 07Whoopi Goldberg44.7%
  8. 08Shannon Sharpe40.8%
  9. 09Cornel West38.8%
  10. 10Tiffany Cross38.7%

Voices with the largest Hispanic audience share

Share of each audience identified as Hispanic. Dashed line marks the U.S. baseline of 11.0%.
0%99%
  1. 01Jorge Ramos98.5%
  2. 02Julio Ricardo Varela92.9%
  3. 03Maria Hinojosa82.7%
  4. 04Mike Majlak58.0%
  5. 05Logan Paul21.6%
  6. 06Akaash Singh18.0%
  7. 07Andrew Tate17.2%
  8. 08Adin Ross15.6%
  9. 09Dean Withers13.2%
  10. 10Jesse Sebastiani11.5%

Voices with the largest Asian audience share

Share of each audience identified as Asian. Dashed line marks the U.S. baseline of 4.5%.
0%46%
  1. 01Dwarkesh Patel45.8%
  2. 02Ronny Chieng39.8%
  3. 03Chamath Palihapitiya36.6%
  4. 04David Friedberg23.4%
  5. 05Akaash Singh21.2%
  6. 06Jason Calacanis14.1%
  7. 07David Sacks13.8%
  8. 08Fareed Zakaria12.7%
  9. 09Anthony Pompliano11.8%
  10. 10Evan Osnos11.6%

Voices with the largest working-class audiences

Share of each audience with household income under $50,000. Dashed line marks the U.S. baseline of 29%.
0%29%
  1. 01Jesse Sebastiani28.0%
  2. 02Shaun28.0%
  3. 03Dean Withers26.7%
  4. 04Second Thought25.8%
  5. 05Andrew Callaghan25.8%
  6. 06Adam Friedland25.2%
  7. 07Knowledge Fight24.4%
  8. 08David Pakman24.3%
  9. 09Philosophy Tube24.2%
  10. 10Vaush24.2%

The 10 voices reaching the most law enforcement and security

Peer index, 100 = the average voice in this Index.
14564
  1. 01Kori Schake564
  2. 02Eliot Cohen260
  3. 03Danielle Pletka248
  4. 04Roland Martin247
  5. 05Walter Russell Mead246
  6. 06Mark Dubowitz241
  7. 07Kimberly Nicole Foster237
  8. 08Jamie Kirchick235
  9. 09Symone Sanders231
  10. 10Brett Cooper229

The 10 voices reaching the most educators

Peer index, 100 = the average voice in this Index.
14206
  1. 01Beth Silvers206
  2. 02Sarah Stewart Holland193
  3. 03Rebecca Nagle166
  4. 04David Griscom159
  5. 05V Spehar158
  6. 06John Nichols158
  7. 07Cornel West154
  8. 08Heather Cox Richardson153
  9. 09Russell Moore152
  10. 10Michael Hobbes146

The 10 voices reaching the most non-profit and volunteer workers

Peer index, 100 = the average voice in this Index.
14239
  1. 01Russell Moore239
  2. 02Myron Gaines204
  3. 03Roland Martin202
  4. 04Rhiannon Hamam182
  5. 05Symone Sanders178
  6. 06Marc Lamont Hill159
  7. 07Eric Metaxas145
  8. 08Danielle Moodie140
  9. 09Cornel West140
  10. 10V Spehar140

The 10 voices reaching the most software engineers

Peer index, 100 = the average voice in this Index.
8456
  1. 01Shaun (@Shaun_vids)456
  2. 02Philosophy Tube408
  3. 03Dwarkesh Patel403
  4. 04Vaush (@Vaush)347
  5. 05Contrapoints (@ContraPoints)340
  6. 06Hasan Piker336
  7. 07Eric Weinstein282
  8. 08Adam Friedland280
  9. 09Lex Fridman263
  10. 10Felix Biederman262

The 10 voices whose audience works in media

Share of audience employed in the media industry
2%25%
  1. 01Max Tani25.2%
  2. 02Lydia Polgreen22.3%
  3. 03Carlos Lozada22.2%
  4. 04Lisa Lerer21.6%
  5. 05Dylan Byers19.9%
  6. 06Moira Donegan19.5%
  7. 07Trymaine Lee19.4%
  8. 08Mark Leibovich18.6%
  9. 09David Plotz18.1%
  10. 10Noah Kulwin18.0%

The 10 voices reaching the most legal professionals

Peer index, 100 = the average voice in this Index.
40583
  1. 01Leah Litman583
  2. 02Kate Shaw480
  3. 03Rhiannon Hamam472
  4. 04Melissa Murray391
  5. 05Dahlia Lithwick369
  6. 06Peter Shamshiri362
  7. 07Ken White297
  8. 08Ramesh Ponnuru283
  9. 09Elie Mystal278
  10. 10Sarah Isgur260

The 10 voices reaching the most construction and trades workers

Peer index, 100 = the average voice in this Index.
7220
  1. 01Brett Cooper220
  2. 02Anthony Brian Logan (ABL)193
  3. 03Steve Bannon183
  4. 04Adam Friedland171
  5. 05Steve Deace166
  6. 06Nick Fuentes161
  7. 07Matt Christman160
  8. 08Brandon Tatum157
  9. 09Allie Beth Stuckey154
  10. 10Delano Squires152

The 10 voices reaching the most transportation and logistics workers

Peer index, 100 = the average voice in this Index.
5367
  1. 01Myron Gaines367
  2. 02Roland Martin252
  3. 03Glenn Beck242
  4. 04Brett Cooper229
  5. 05Anthony Brian Logan (ABL)220
  6. 06Francis Foster220
  7. 07Mark Levin202
  8. 08Deneen Borelli196
  9. 09Eric Weinstein186
  10. 10V Spehar186

The 10 voices reaching the most real estate brokers

Peer index, 100 = the average voice in this Index.
1205
  1. 01Mark Levin205
  2. 02Lara Trump192
  3. 03Steve Bannon192
  4. 04Glenn Beck178
  5. 05Gianno Caldwell177
  6. 06Megyn Kelly167
  7. 07Brian Kilmeade164
  8. 08Buck Sexton161
  9. 09Eric Bolling161
  10. 10Tucker Carlson161

The 10 audiences most engaged with social justice

Peer index, 100 = the Index average. Grey bars: every audience measured.
301,062
  1. 01Touré1,062
  2. 02Lewis Goodall1,016
  3. 03Emily Maitlis811
  4. 04Rory Stewart794
  5. 05Alastair Campbell730
  6. 06Helen Lewis699
  7. 07Jason Selvig654
  8. 08Jon Sopel619
  9. 09Nima Shirazi520
  10. 10Ash Sarkar519

The 10 audiences most engaged with gun laws

Peer index, 100 = the average audience in this Index.
291,385
  1. 01Jason Selvig1,385
  2. 02Adam Mockler291
  3. 03Dean Withers236
  4. 04V Spehar229
  5. 05Harry Sisson213
  6. 06Touré212
  7. 07Aaron Parnas205
  8. 08Olivia Julianna204
  9. 09Beth Silvers192
  10. 10Sarah Stewart Holland188

The 10 audiences most engaged with free speech

Peer index, 100 = the average audience in this Index.
28591
  1. 01Eric Weinstein591
  2. 02Anthony Brian Logan (ABL)583
  3. 03Sam Harris521
  4. 04Brandon Tatum515
  5. 05Sydney Watson505
  6. 06Francis Foster485
  7. 07Steven Crowder466
  8. 08Gianno Caldwell444
  9. 09Shawn Ryan441
  10. 10Michael Knowles438

The 10 audiences most engaged with tax policy

Peer index, 100 = the average audience in this Index.
38341
  1. 01Nick Gillespie341
  2. 02Matt Welch301
  3. 03Jim Geraghty286
  4. 04Erick Erickson272
  5. 05Mary Katharine Ham269
  6. 06Stephen Hayes265
  7. 07Michelle Malkin258
  8. 08Rich Lowry251
  9. 09Jason Riley250
  10. 10Ramesh Ponnuru246

The 10 audiences most engaged with climate change

Peer index, 100 = the average audience in this Index.
  1. 01Nima Shirazi159
  2. 02Rebecca Nagle158
  3. 03David Griscom156
  4. 04Philosophy Tube149
  5. 05Joy Behar149
  6. 06Ash Sarkar145
  7. 07Andrew Callaghan147
  8. 08Nicholas Kristof142
  9. 09Shaun142
  10. 10Michael Moore140

The 10 audiences most engaged with health care policy

Peer index, 100 = the average audience in this Index.
  1. 01David Griscom528
  2. 02Amber A'Lee Frost390
  3. 03Matt Christman390
  4. 04Virgil Texas390
  5. 05Nima Shirazi383
  6. 06Felix Biederman383
  7. 07Matt Lech355
  8. 08Will Menaker331
  9. 09Shaun330
  10. 10Adam Friedland328

The 10 audiences most engaged with criminal justice reform

Peer index, 100 = the average audience in this Index.
  1. 01Adam Mockler309
  2. 02Michael Hobbes206
  3. 03Leah Litman199
  4. 04Ben Meiselas186
  5. 05Kate Shaw179
  6. 06Melissa Murray178
  7. 07Danielle Moodie174
  8. 08Dahlia Lithwick173
  9. 09Andrew Weissmann169
  10. 10Brett Meiselas166

The 10 audiences most engaged with inflation

Peer index, 100 = the average audience in this Index.
  1. 01Kyla Scanlon454
  2. 02Joe Weisenthal408
  3. 03Tyler Cowen362
  4. 04Eric Weinstein313
  5. 05David Friedberg313
  6. 06Anthony Pompliano300
  7. 07Noah Smith291
  8. 08Chamath Palihapitiya251
  9. 09Dwarkesh Patel245
  10. 10Megan McArdle238

The 10 audiences most engaged with foreign policy

Peer index, 100 = the average audience in this Index.
  1. 01Kori Schake255
  2. 02Danielle Pletka210
  3. 03Jonathan Schanzer210
  4. 04Walter Russell Mead208
  5. 05Mark Dubowitz204
  6. 06Evan Osnos202
  7. 07Eliot Cohen201
  8. 08Fareed Zakaria195
  9. 09Thomas Friedman175
  10. 10Nicholas Kristof174

An index, not a share. 100 is the average audience in this Index, so 341 means roughly three and a half times more engaged with that issue than the typical political audience here, not 341 percent of anyone. The figures are size-adjusted. Four of the 35 issues measured are ranked here, chosen editorially rather than by any threshold.

What the Index found

Who matters changes depending on the audience you are trying to reach

Overall reach shows who commands attention at scale. Every other measure in the Index surfaces a different set of names.

Attention lives outside politics

No working journalist reaches the ten biggest audiences in political conversation

The ten biggest audiences belong to podcasters, comedians and commentators. Not one belongs to a working news journalist. The largest audience held by a journalist is Anderson Cooper’s, at 8.3 million, which is smaller than the tenth largest audience in the Index and about an eighth the size of Logan Paul’s.

Creators own the youngest audiences

Mike Majlak and Adin Ross lead the ranking of audiences under 35, with Logan Paul, Stavros Halkias and Akaash Singh also in the top ten. Online creators, not political media, reach the youngest voters.

Nearly two thirds of David Friedberg’s audience is in six-figure households

David Friedberg tops the ranking with 65% of his audience in households earning $100,000 or more, with David Sacks just behind him, alongside Anthony Pompliano, Scott Galloway, Kara Swisher and Chamath Palihapitiya. The wealthiest audiences in political conversation follow tech and business voices.

The biggest voices miss where the midterms happen

None of the top ten dominate the battlegrounds

Erick Erickson leads the battleground ranking, followed by Roland Martin and Michael Smerconish. Not one of the biggest overall voices appears among those with the highest audience concentration across the seven battleground states.

The biggest voices rank 274th or worse on local news

Every one of the ten biggest voices falls below the roster median on local news, and the best placed of them, Anderson Cooper, ranks 274th of 488. Local news remains a primary midterm information channel, and the ranking is led by Lisa Lerer, Lester Holt and Martha Raddatz.

Roughly a quarter of Danielle Pletka’s audience lives in Washington, D.C.

Danielle Pletka leads on share of audience located inside the district, with John Ashbrook and Kori Schake behind her, and the D.C. list skews toward foreign policy experts and political reporters. The bench the capital listens to barely overlaps with the bench the country listens to.

Audiences sort themselves in ways a follower count cannot show

The tightest echo chambers sit on the populist right

All ten of the most politically concentrated audiences belong to voices in the MAGA and populist right, led by Rogan O’Handley, Brandon Tatum and Dinesh D’Souza. The scale runs from a roster median of 1.82 to 3.14 at the top.

The most balanced audiences belong to the right, not the center left

Bipartisan reach is led by Reihan Salam and Jamie Kirchick, followed by David French, Tom Holland and Jason Calacanis. Every one of the ten most balanced audiences belongs to a center, heterodox or Never Trump right voice. No straight news journalist and no establishment liberal appears among them. By faction, the MAGA and populist right sits last at a median of 17.0 against a roster median of 42.4.

A foreign policy expert owns the law enforcement audience

Kori Schake’s audience is roughly 5.6x more concentrated in law enforcement and security than the average voice measured, a sharper split than any political signal in the Index. Beth Silvers leads among educators, Russell Moore among non-profit workers. In 12 of the 50 state rankings the top of the card belongs to co-hosts of a single show whose audience happens to cluster there rather than to voices with a following in that state.

“Our new Index shows that who matters can change dramatically depending on the audience you’re trying to understand. We’re seeing a very different mix of voices emerge across the country and within specific political communities. As we get closer to the midterms, these are the audiences and voices I think everyone should be watching.”

Michael Hussey, President, StatSocial

Methodology

How the Index was built

Every figure in the Index is measured from cross-platform public social signals resolved to real identities through StatSocial’s PeopleGraph and enriched via its KnowledgeGraph, with no survey, modeled, or synthetic data. An index of 100 represents the average voice in this Index rather than the average American, and political labels are assigned editorially, never derived from audience data. More information on the methodology is available upon request.

Audience measurement

Each voice’s audience is built from cross-platform public social signals resolved to real identities through StatSocial’s PeopleGraph, then enriched with demographic, household and behavioral attributes from the KnowledgeGraph, which spans more than 300,000 attributes. Every figure in the Index is measured this way. The Index contains no survey data and no modeled or synthetic responses.

Sample thresholds

An audience must resolve at least 5,000 matched identities to be included. Voices below that threshold are excluded rather than reported with reduced confidence.

Faction definitions

Each voice carries one editorially assigned political label, for example MAGA and populist right, traditional conservative, Never Trump right, establishment liberal, progressive left, socialist and DSA left, or centrist and heterodox. The label reflects public political identity and is independent of the measured composition of the audience. As an external check, median audience right share tracks the labels in the expected order across the spectrum, without the labels ever being derived from audience data.

Echo chamber score

Each audience’s echo chamber score reflects how much more concentrated its dominant political faction is compared with that faction’s expected share if the audience were politically unsorted. A score of 1.0 is indistinguishable from a random audience.

Bipartisan reach

Bipartisan reach is calculated from an audience’s overall right of center share: 100 minus twice the distance of that share from an even split. A perfectly balanced audience scores 100. An audience entirely on one side scores 0.

Composition and index

Findings are expressed either as audience composition, meaning the share of an audience with a given characteristic, or as an index, which shows how strongly an audience over indexes for a characteristic relative to the applicable baseline. An index of 100 matches the baseline.

Footnote: Political classifications reflect how individual voices are identified within the Index and are separate from the measured characteristics of their audiences. Battleground state analysis refers to the seven states identified as presidential battlegrounds in the 2024 election: Arizona, Georgia, Michigan, Nevada, North Carolina, Pennsylvania and Wisconsin.

Frequently asked questions

Questions about the Political Influencer Index

See it on your audience

Run this analysis on any audience you care about

The Index uses the same platform available to StatSocial customers. Bring us a talent roster, a competitor’s following, a customer list or a set of political voices, and we will show you who is behind it.

  • Audience level reach, favorite creators, media preferences and demographics
  • Political composition, factional concentration and bipartisan reach
  • Over indexing interests and affinities from 300,000+ attributes
  • Cross-platform overlap across majors social networks

Book a demo

Having trouble seeing the form? Open the form here