
 Today we are unveiling something brand new for StatSocial — a mountain of B2B data married to our patented identity graph and audience intelligence platformSilhouette. All of this is ready to be leveraged across our key use cases (insights, attribution, and activation). This is an unprecedented opportunity for B2B marketers to analyze more than 40 million business people, including the companies they work for, industries they work in, and job titles, all cross-referenced against Silhouette’s industry-leading insights.
To demonstrate the power of B2B audience data inside of Silhouette, we’ll be sharing a series of entries comparing the employees of tech giants Amazon, Apple, Google, and Microsoft. If you’d like to see similar insights on other B2B data-sets, please contact us.
It makes sense to begin with the fundamentals, the gender and age breakdowns of the employee bases across these four tech giants. This analysis was completed by analyzing over 30K employees from each company.
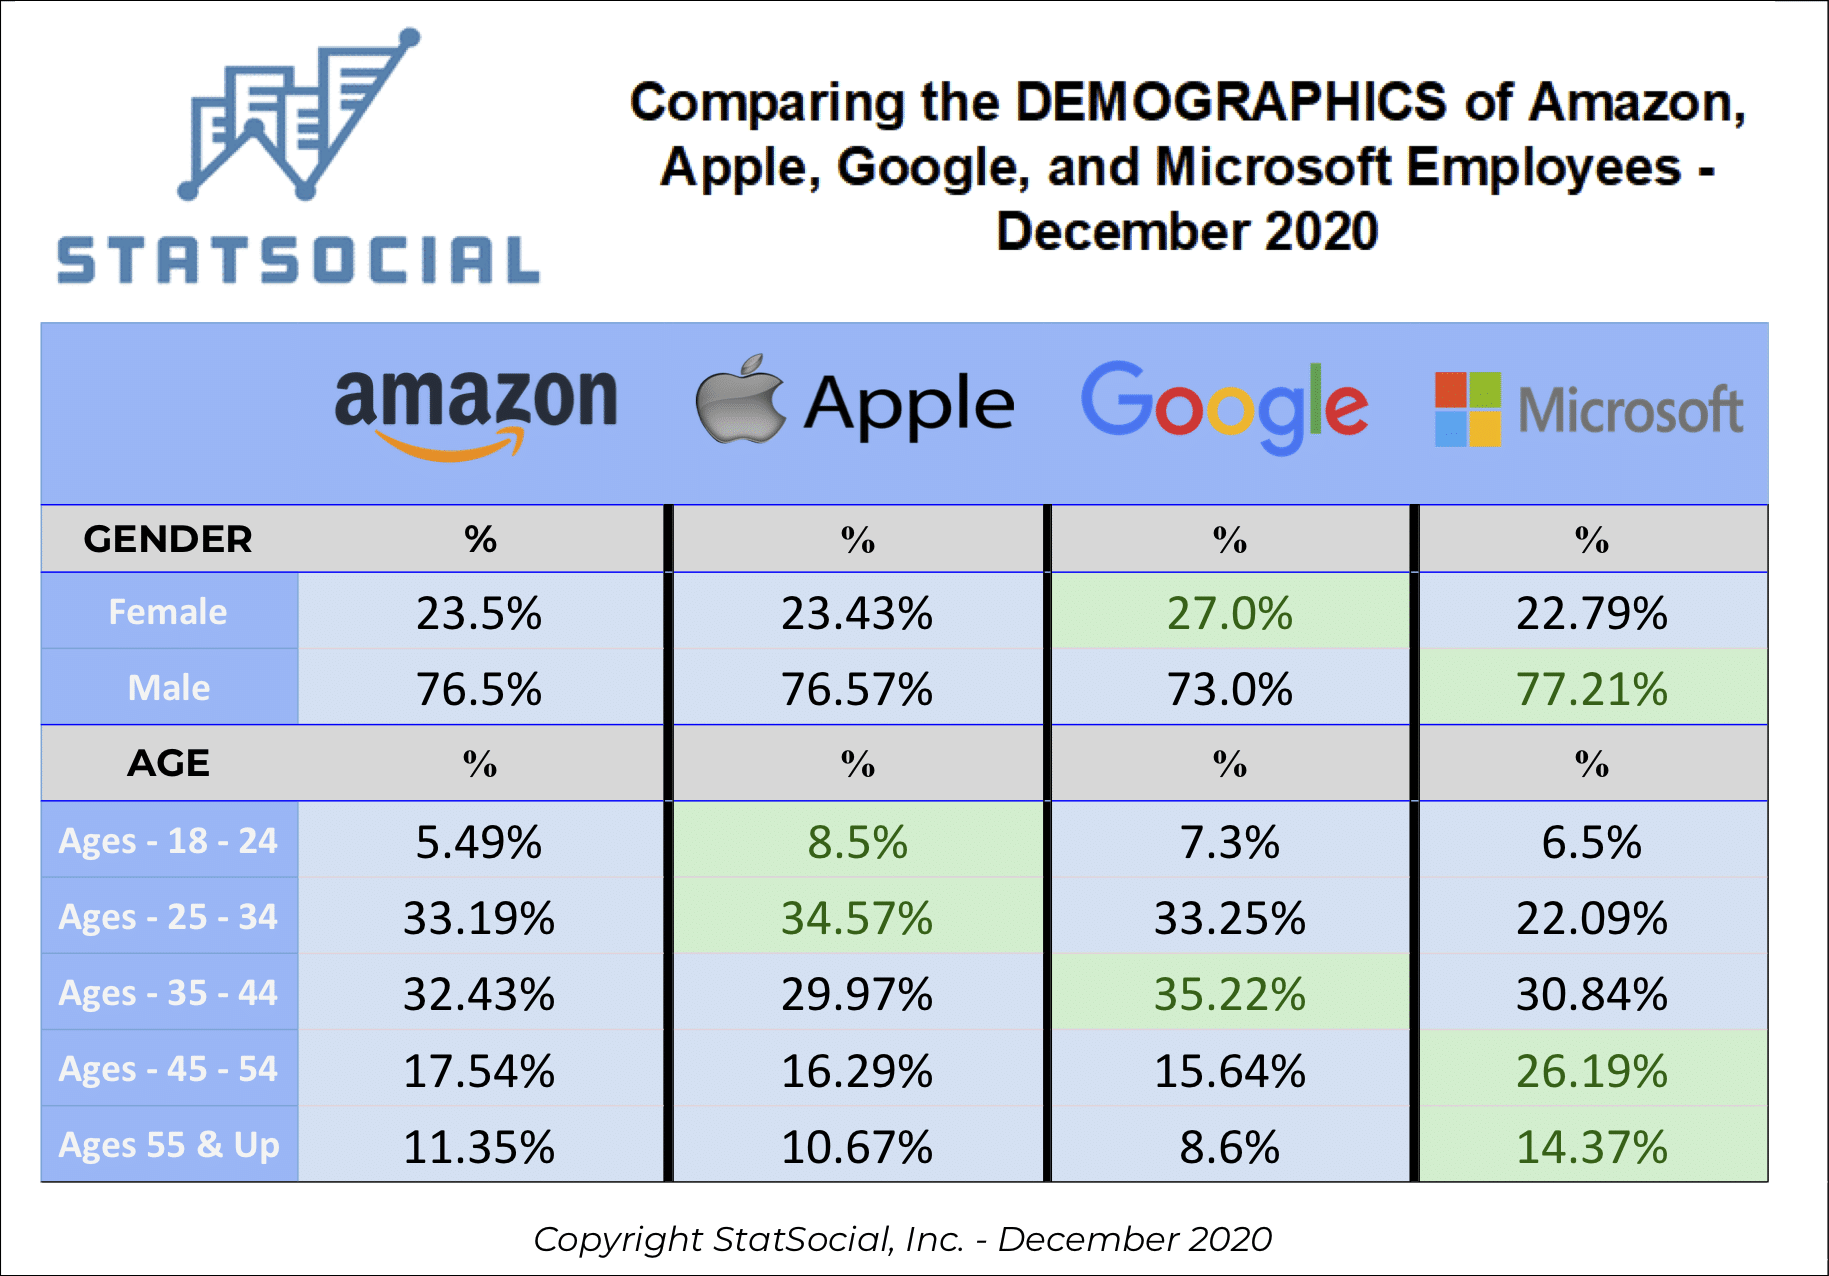
Starting with gender, we know we won’t be shattering any illusions by reporting that each group of employees leans heavily male. In the cases of Amazon, Apple, and Microsoft, women account for less than ¼ of the audiences under our microscope.
Google‘s employees, however, are 27% female.
Next up, ages. Of the four groups, Apple‘s employees contain the largest segment between 18 and 24. The generally younger staffs working at their celebrated and influential retail stores may be a factor. Wherever they may work, however, the company itself reports that over ⅓ of their employees are under 30.
As stated above, and with this much established, we will be digging deeper into these audiences, now that we know the basics. You will be able to find further entries at the B2B tag on our insights blog, and if you want to dive deeper into StatSocial and Silhouette beyond the B2B, you’re invited to peruse the greater insights blog in general.
——————————————————————————————
How It Works
INSIGHTS
When trying to convey the depth, breadth, and scale of StatSocial‘s Social Affinity and Earned Media data, we sum it up like this: Imagine an 85,000 question survey given out to 300 million consumers. Now, imagine this already incredible thing as a living, dynamic data set. This survey is being administered in real time, constantly, being continually refreshed to include all of the most up-to-date opinions, choices, affinities, and actions. Learn more here.
ATTRIBUTION
Marketers and media-sellers know that Earned Media and Influencer Marketing are valuable components of their campaigns. Attributing a definitive worth to either, however, has traditionally been elusive. As StatSocial’s analyses report of with what topics and influencers an audience’s members have been engaging, a marketer can now directly attribute website and offline conversions. The same metrics that marketers have long relied upon to quantify the value of a campaign’s Paid and Owned Media components, are now just as readily available for Earned Media. Learn more here.
ACTIVATION
StatSocial‘s vast and comprehensive taxonomy is accessible across every programmatic platform. Our partnership with Liveramp, and direct integrations with such leading platforms as Viant, Oracle Data Cloud, Eyeota, and Lotame, finds StatSocial‘s insights available everywhere you access audience data. We are also available, via our 24/7 online to get you the insights and audiences you need, when you need them. Learn more here.